What information does the Incentives tab report?
The Incentives tab provides both an overview and a detailed breakdown of all points and how they have influenced member activity.
For information on the actions you can perform on the visualizations and key performance indicators (KPIs), see Common operations.
Filtering in the Incentives tab
Use the Incentives tab to filter by specific tiers and date ranges. Click anywhere on the Controls bar to expand it. Filtering controls are available at the top of the tab, including tier and date ranges, as shown below:

Expand all controls by clicking on any single control or by clicking the arrow on the far right. Use the controls to focus on particular areas of interest.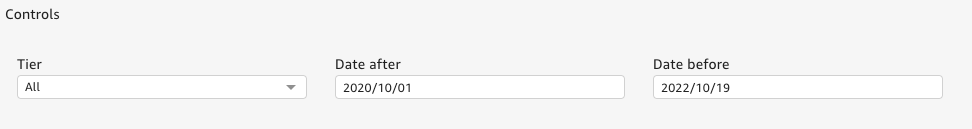
-
Tier allows you to toggle which tiers are visualized. You must first select a value to see a specific tier’s details. By default, all tiers are shown.
-
Date after and date before allow you to select the range of dates within which the displayed data is aggregated. Indicators are updated to aggregate data for only the selected period, while charts have their date ranges adapted to the selection. By default, data for the past two years is shown.
Indicators and charts
The top left of the dashboard contains indicators that aggregate key metrics across all the selected tiers and dates. On the right, these metrics are shown on bar charts, providing a breakdown by period (day, week, month, quarter, year) so that you can identify trends, patterns or anomalies.
By default, all tiers are selected. Select specific tiers using the Controls on the top bar (see Filtering section above).
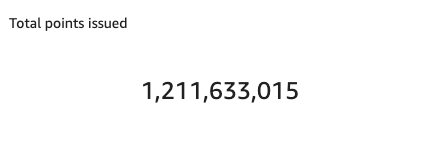
An example of indicator is shown below. It contains a single number representing the aggregated values across all selected tiers for the selected period.
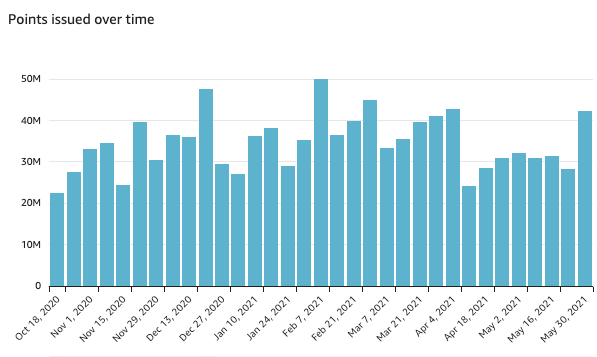
The following chart provides visibility for the metric - also aggregated across selected tiers and date range - but showing the time on its horizontal axis and counts on its vertical axis. Right-click on a bar to drill-up or drill-down and obtain a view at a different aggregation level.
Point liability
Point liability shows an overview of how many points have been issued (made available in a member’s wallet, but have not been redeemed by the member, expired or revoked by the merchant).
This metric provides an overview of how much potential member engagement can occur related to existing points, helps you understand member interest across periods of time and more precisely manage liability and member interactions.
Points issued
This metric relates to the total number of points issued across all members. For example, if a point was issued to member A and another point to member B, it would add a count of 2 into the Points issued indicator and counts of 1 to the corresponding days on the bar chart.
The bar chart demonstrates the rate at which and the history of when points are issued. Use it as a health check for the program and track if there are certain periods when points are issued at increased rates.
Points redeemed
This metric shows total numbers of points redeemed across all members. So, if a point was redeemed by member A and another point by member B, it would add a count of 2 into the indicator and counts of 1 on the respective days on the chart. Use the chart to analyze what point redemption looks like for members and whether or not members are actually redeeming points. The bars are a factor of both points and members, so this chart paints a good picture of point performance over time. View this chart with points issued over time and points expired over time to identify causes of dips and peaks and to analyze what point-related activities work best for members.
Points expired and Points revoked
These metrics are counted on the visuals similarly to points redeemed, but are not dependent on member action.
-
Points that expired on specific dates are counted towards the Points expired indicator and added to the appropriated date on the bar chart.
-
Points revoked are related to a decision by the merchant to revoke the point, so are counted separately from points expired. This provides a clear idea of which points have expired due to member inaction (for example, lack of user interest, not enough time to redeem) without considering points that have been removed from a member’s wallet for reasons not related to them.
Total points by current loyalty tier
Use the overview shown below to compare high-level KPIs across all tiers for a more granular breakdown of information. Performance for each tier can be analyzed with the points status counts. Lower-performing tiers can be further analyzed and improved. For example, you can quickly answer the question: Are most of the points for tier X being redeemed before expiration? The KPIs can be described as follows:
-
Rank: Position of the tier within the tier system.
-
Current loyalty tier: Loyalty tier to which a member is currently assigned.
-
Point liability: Count of points that have been issued and have not been redeemed, revoked or expired.
-
Points issued: Count of total points issued that have reached a member’s wallet. This metric includes points that are still in the issued status, and points that have been redeemed, revoked or expired.
-
Points redeemed, expired and revoked: Count of points that have been deduced from a member’s wallet, according to the deduction method.
![]()