View information for specific campaign
Use the following tabs to see information about a specific campaign:
The actual tabs available for a campaign depend on that campaign's status.
Setup tab
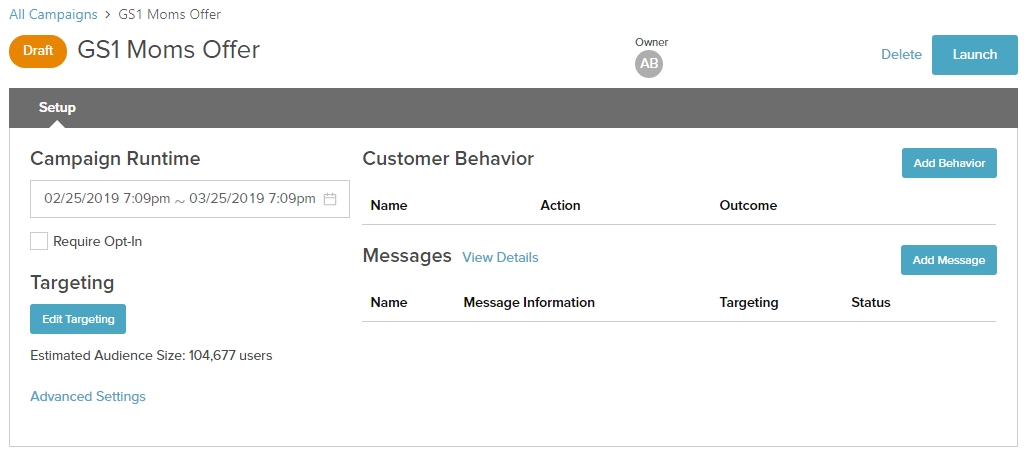
Use the Setup tab to view the components defined for a campaign. See Building campaigns for detailed discussion on the Setup tab.
Calendar tab
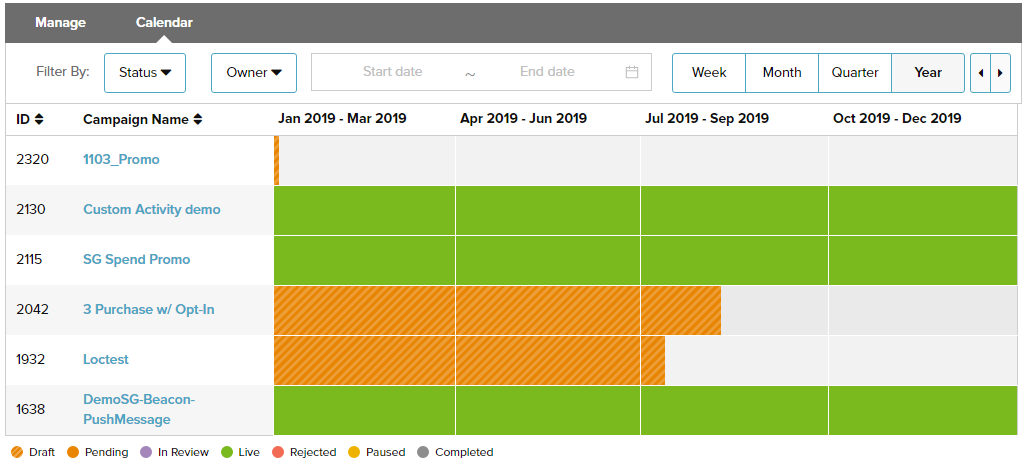
If a campaign includes scheduled messages, the Calendar tab shows when those messages are scheduled for delivery.
Performance tab
Once a campaign has been launched, the Performance tab becomes available. Use this tab to monitor the performance for all active, completed and paused executions, messages and behaviors.
View Execution Reporting
The Execution Reporting tab provides daily reporting metrics for all of the executions in your campaign.
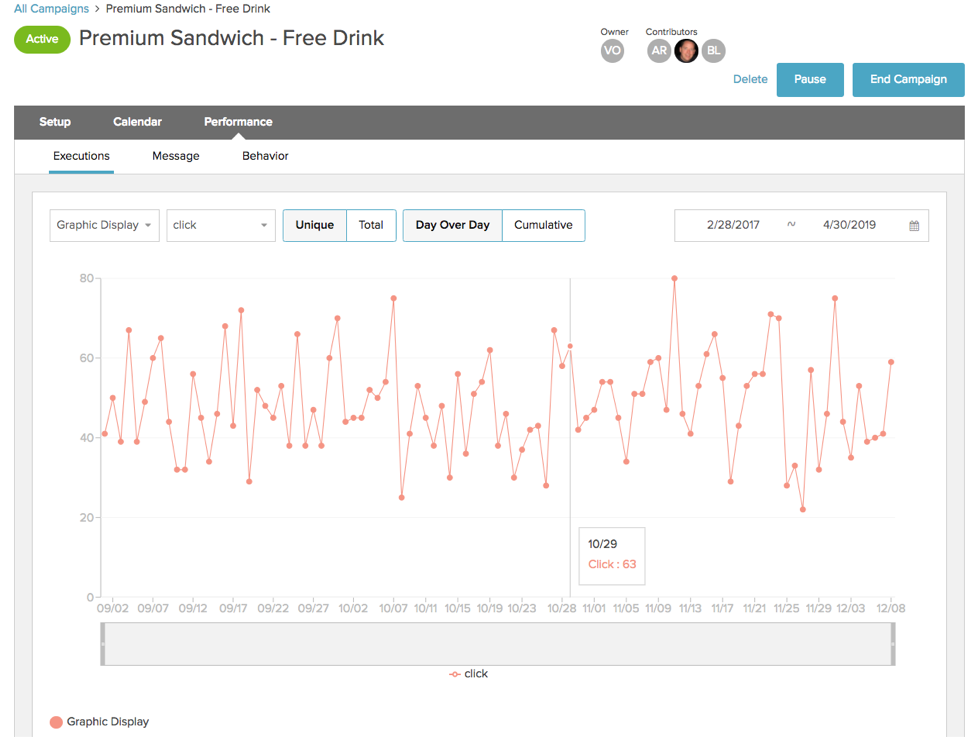
The Execution Reporting tab contains performance measures for your executions, including:
- Execution Selection – Multi-select list that toggles visibility for any/all executions for which you would like to see performance measures.
- Metric Selection – Selection between impression and engagement performance data shown in the graph.
- Action Selection – Selection between metrics totals or the unique number of customers who triggered the reported metric.
- Date Window – Date range you would like to view in the graph.
- Reporting Key – Color-coded guide to the execution data being shown in the graph.
- Raw Data – Tabular view of all basic metrics (volume totals) in the selected date range for the graph.
View message reporting
The Message Reporting tab provides daily reporting metrics for all messages in your campaign.
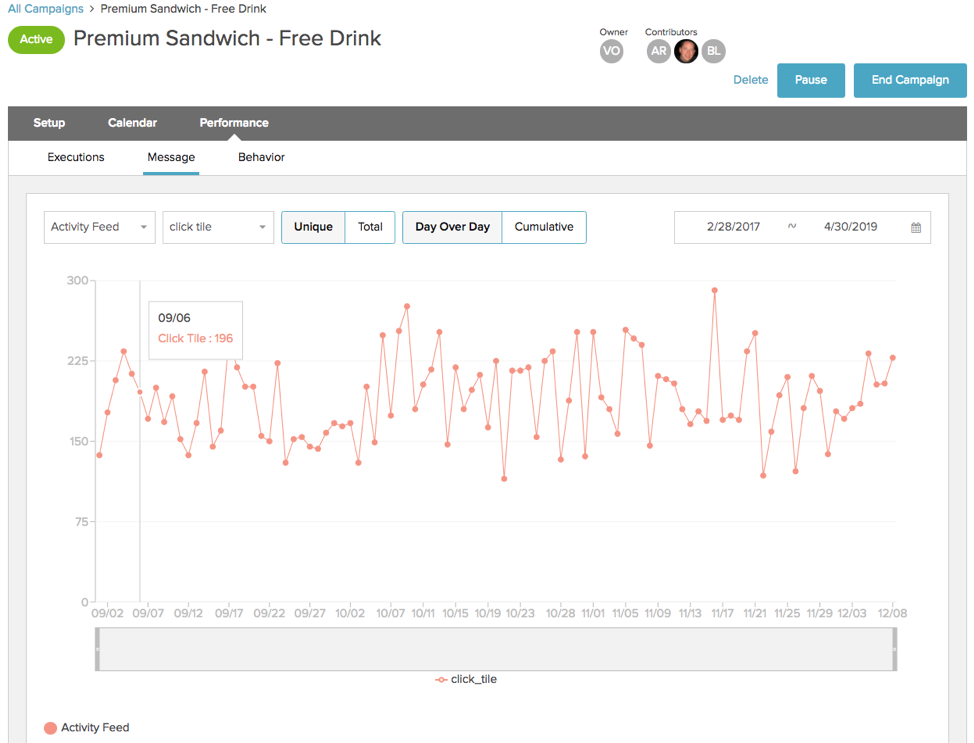
The Message Reporting tab displays performance aspects of your messages, including:
- Message Selection – Multi-select list that toggles visibility for any/all messages you would like to see performance data for.
- Metric Selection – Selection between impression and engagement performance data shown in the graph.
- Action Selection – Selection between metrics totals or the unique number of customers who triggered the reported metric.
- Date Window – Date range you would like to view in the graph.
- Reporting Key – Color-coded guide to the message data being shown in the graph.
- Raw Data – Tabular view of all basic metrics (volume totals) in the selected date range for the graph.
View Behavior Reporting
The Behavior Reporting tab provides daily reporting metrics for all behaviors in your campaign.
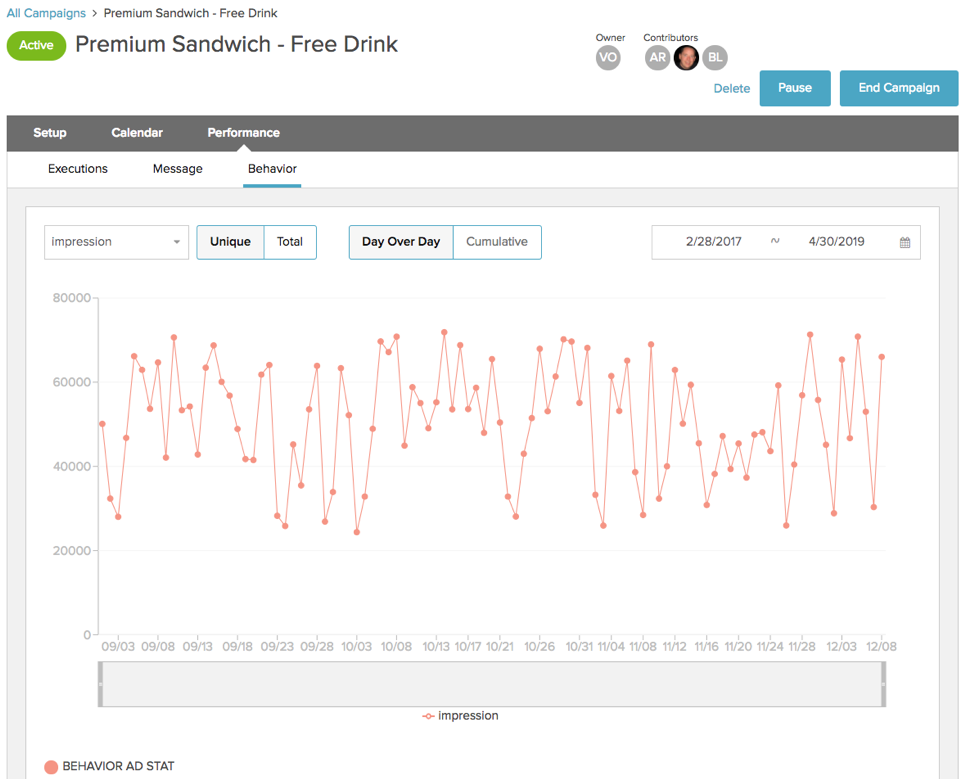
The Behavior Reporting tab contains the following elements:
Metric Selection – Multi-select that toggles visibility for behavior engagement and completion in the campaign.
Action Selection – Selection between metrics totals or the unique number of customers who triggered the reported metric.
Date Window – Date range you would like to view in the graph.
Reporting Key – Color-coded guide to the behavior data being shown in the graph.