About Insights
The Insights reporting tool provides a detailed view into the data surfaced within the SessionM platform, helping you understand performance and measure against critical key performance indicators (KPIs).
- What information does the Summary tab report?
- What information does the Campaigns tab report?
- What information does the Incentives tab report?
- What information does the Offers tab report?
Key notes
-
Insights uses the SessionM Data Cloud for its source of truth. The Data Cloud is updated daily, so Insights does not display real-time data.
-
For reporting purposes, Insights uses only one point economy to report membership and tier member counts. Consult with your SessionM client services team to determine the correct configuration for your program.
Insights features
The current instance of Insights features the following features:
- Filters
Filter reports based on specific values for attributes. For instance, use the Offers tab to filter on root offer names. - Drilldown Charts
Explore data in more depth by revealing one or more additional layers of information. For instance, use the Incentives tab to drill up or down points issued, providing additional insight from the same chart. - Variable Time Window
Charts that have time values for the X-axis typically have a 4-week or 8-week view on display by default. Scroll through dates by selecting the chart and using their mouse to perform a standard scroll-down (or up) activity.
Common operations
Insights provides data visualizations - or visuals - of membership, offers, incentives and transactions data in the SessionM platform. You can view the data for the visual as described below.
Most visuals can be evaluated a few different ways. Of course, you can simply review the visual shown in a particular tab.
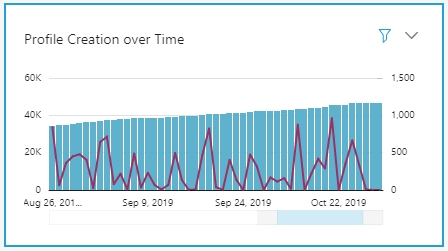
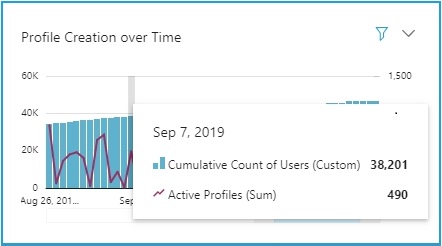
Hover the cursor over a specific portion of the data visualization to display a popover that contains the data associated with that portion of the visualization.
Some data visuals provide the ability to drill down into or up from levels of data. The available options vary with the visual. For example, for profile creation over time, the levels include:
- Year
- Quarter
- Month
- Week
- Day
- Hour
- Minute
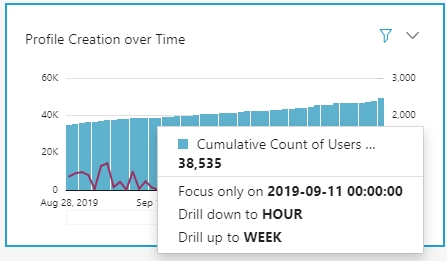
The data shown below is depicted by the day. Click on any part of a day's data (represented in one of the blue bars) to see the following options: drilling down further into hourly data or drilling up into weekly data:
When you drill down to "Hour," the options include drilling down to minute data or drilling back up to day data:
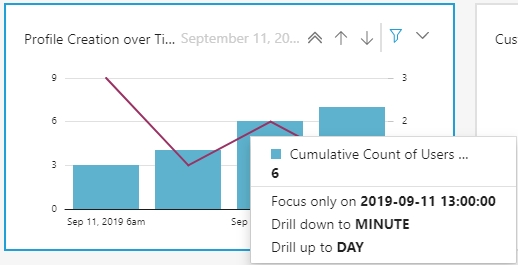
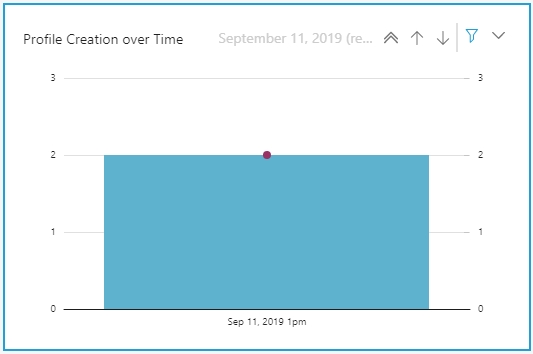
Similarly, select the "Focus only on" option to see a particular snapshot of data - in this case, profile creation as of 1:00 pm on September 11, 2019:
Export and download the data represented in a visual to a CSV file.
- From the desired tab on the Insights dashboard, select the visual with data you want to export to CSV.
- Then click
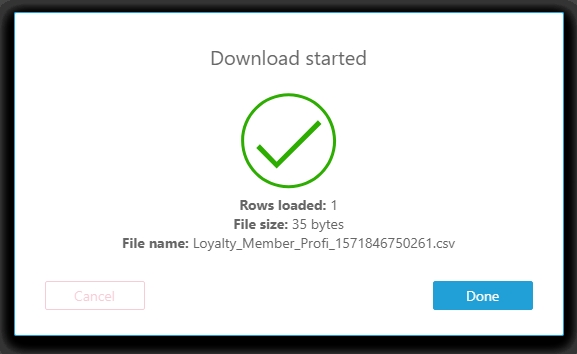
 and select Export to CSV A download status modal displays and the CSV file named in the modal is available:
- Click Done to close the modal.